Mohsen Majidi Pishkenari

0 %
Mohsen Majidi Pishkenari
Data Scientist Data Analytics Backend Developer
    0

    No products in the cart.

    Gas Turbine Emission Prediction

    31 May 2023

    Python can be a useful tool for analyzing by using machine learning techniques. Here’s a general outline of how I could approach it:
     
    1. Data collection: Gather a dataset of gas turbines.
     
    2. Data preprocessing: Clean and preprocess the dataset by handling missing values, normalizing or standardizing features, and splitting it into training and testing sets.
     
    3. Feature selection: Identify the most relevant features. This step helps reduce complexity and improve model performance.
     
    4. Model training: Choose a suitable machine learning algorithm, such as logistic regression, support vector machines, or random forests. Train the model using the training set and evaluate its performance.
     
    5. Model evaluation: Assess the performance of the trained model using evaluation metrics like accuracy, precision, recall, and F1 score. Adjust hyperparameters if necessary to improve the model’s performance. 

    Recently, I worked with a dataset from a gas turbine located in Turkey’s northwestern region. This dataset was generated in 2015 by the Center for Machine Learning and Intelligent Systems (doi:10.3906/elk-1807-87). More specifically, it consists of 7384 instances from 11 sensors.

    The purpose of the study was to analyze CO and NOx emissions, and the data range includes gas turbine parameters and ambient variables. I created three models for gas turbine emission prediction:

    1. Linear regression
    2. Random forest
    3. XGBRegressor

    How it works?

    A) Data preprocessing

    The histogram diagram for each variable to check normality is:

    And to check the outliers, we have:

    The scatter plots for CO variable are:

    And the heatmap plots are:

    I use these libraries for classification of a dataset of Gas turbine:

     seaborn, pandas, TensorFlow, Numpy and matplotlib.

    B) Modeling
     
    To select NOx as target, we should drop CO feature and then normalize data.
    For modeling step, I use LinearRegression , RandomForestRegressor and XGBRegressor methods from sklearn package.
    For each model, we should calculate Mean Absolute Error (MAE). 
    The results show that MAE for Random forest is lower than other and the linear regression 
    has worst MAE.
     
    C) Results
     
    The results showed that the Mean Absolute Error (MAE) for the Random forest model (2.867) was better than the other models.
     
    Abbreviation
     
    AT: Ambient temperature
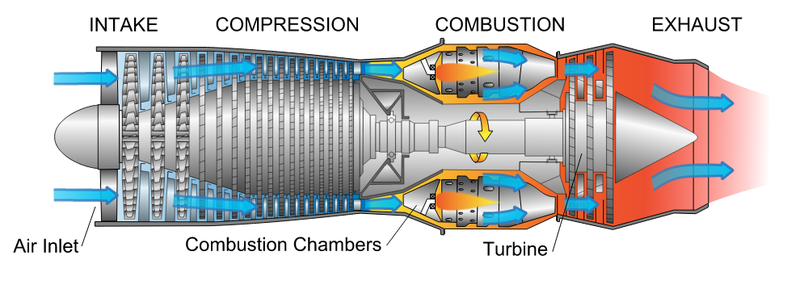
    AP: Ambient pressure
    AH: Ambient humidity
    AFDP: Air filter difference pressure
    GTEP: Gas turbine exhaust pressure
    TIT: Turbine inlet temperature
    TAT: Turbine after temperature
    CDP: Compressor discharge pressure
    TEY: Turbine energy yield
    CO: Carbon monoxide
    NOx: Nitrogen oxides 
    Posted in Python
    Write a comment